
4.3 Prelab: Taxonomy Profiling
4.3.1 Purpose
To use a variety of tools on Galaxy to perform Quality Control (QC), taxonomy profiling, and visualization of a metagenomics sequencing data.
4.3.2 Learning Objectives
Use tools on the Galaxy platform to:
- Import data - by copying from another Galaxy history.
- Perform Quality Control (QC) on raw data - by checking the quality of your raw reads with tool NanoPlot.
- Taxonomically classify data - Run taxonomy workflow (using Kraken 2).
- Visualize taxonomic composition - use tool Krona to generate pie chart.
4.3.3 Introduction
To find out which microorganisms are present in the sample, the sequencing reads are used for taxonomic classification so it is important to have high-quality DNA sequences. To ensure high-quality sequence input, QC (and in many cases also read trimming and filtering) are routinely performed on raw sequences. The reads can then be used for taxonomic classification. To assign taxonomy, we can compare the reads of the sample to a reference database, i.e. sequences of known microorganisms stored in a database, using Kraken 2, which is a k-mer based taxonomic assignment tool. We can then use a visualization tool Krona to interactively visualize and explore the composition of a metagenome. In this activity, however, we will not use these tools individually, but instead, we will run a Galaxy workflow which will chain together and sequentially run multiple tools (Kraken2, Krakentools and Krona pie chart) as a reproducible pipeline.
The sample used in this activity is the Zymo Gut Microbiome Standard, sequenced by Pacific Biosciences using PacBio Sequel II Instrument, and corresponds to sequencing read file SRR13128014. A subset of this data is used in this activity.
4.3.4 Activity 1 – Import data and QC Reads
Estimated time: 25 min
4.3.4.2 Instructions
- Import the data into Galaxy.
- Open the zymo-gut-standard public history
- Click on Import this history, select copy only the active, non-deleted datasets and then Copy History.
- Confirm
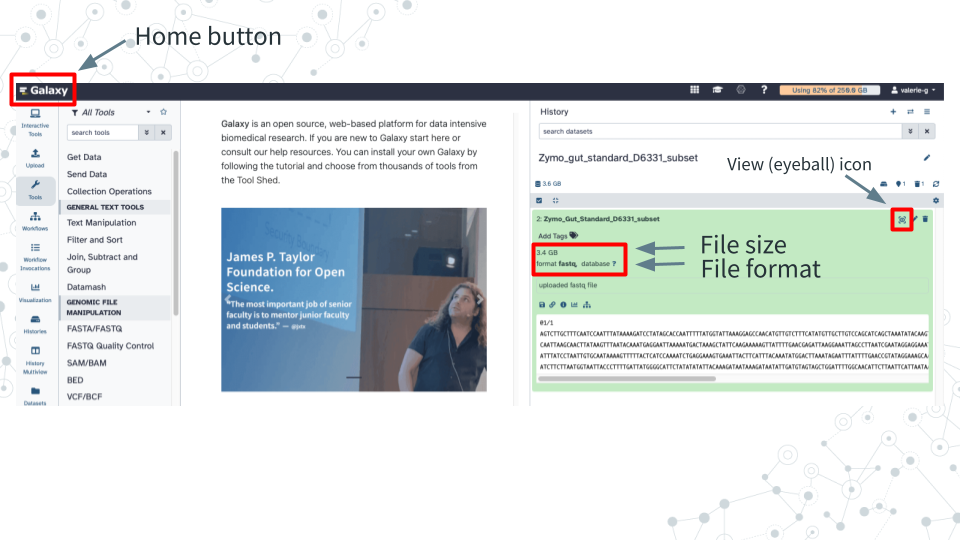
Zymo_Gut_Standard_D6331_subsetexists in your history by clicking on the Home button “Galaxy” on top left. - Click on Zymo_Gut_Standard_D6331_subset to explore its contents.
4.3.4.3 Questions
| 1. What is the size of this downloaded dataset subset? |
|---|
| 2. What is the format/extension of the downloaded file? |
|---|
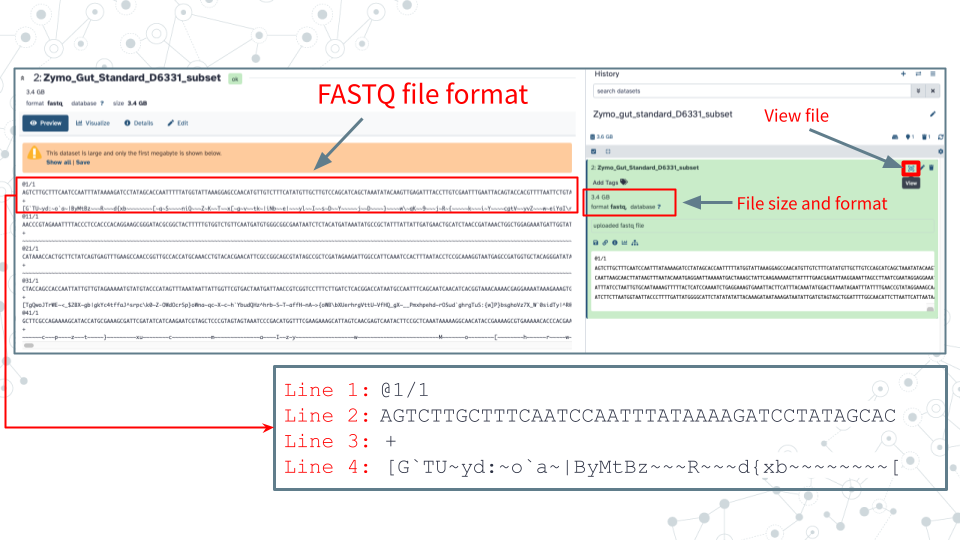
| 3. Click on the Display (eyeball) icon and describe what you see in the 4 lines of the fastq file: |
|---|
| Line 1: |
| Line 2: |
| Line 3: |
| Line 4: |
4.3.4.5 Instructions
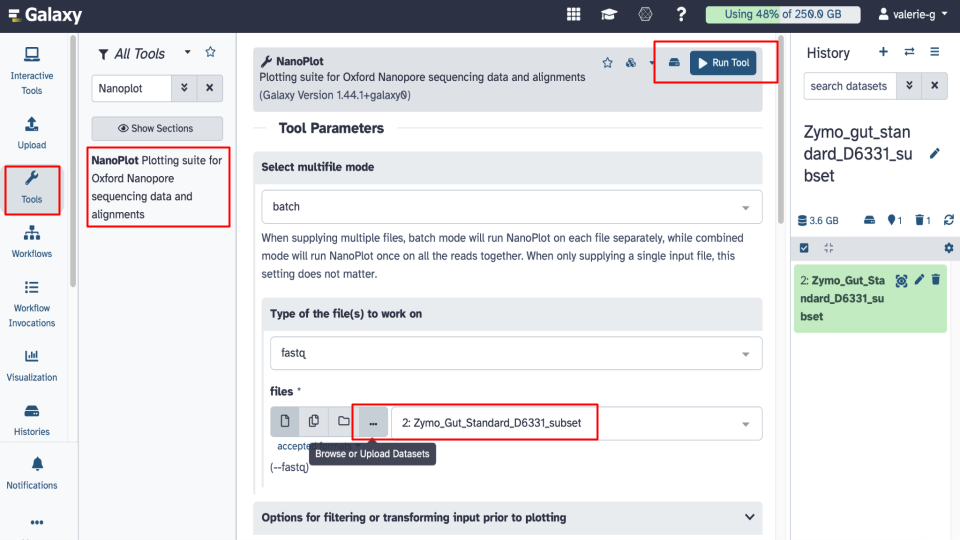
- Run Nanoplot tool in Galaxy using default settings. Under Tool Parameters, check the following settings.
- Under files there are 4 options to select a fastq dataset: Single dataset, Multiple datasets, Dataset collection or option ‘…’ which is Browse or Upload Datasets.
- Browse to select your fastq dataset.
- Note: Galaxy tool may pre-select the correct dataset already for you so just make sure that the file is correct.
- Click on Run Tool and wait ~5-10 minutes as the NanoPlot job is scheduled, run, and complete. Answer related questions below.
- View and examine the NanoPlot results in Galaxy by clicking on the View (eyeball) next to the NanoPlot output.
4.3.4.6 Questions
What are some features of the NanoPlot tool in Galaxy?
1A. Under Type of file(s) to work on, check to see what input files are compatible with NanoPlot and name 2 file extension options listed. File extension name 1: File extension name 2: 1B. Click to expand Options for filtering or transforming input prior to plotting and name 3 options you could use to filter your sequencing data. 1. 2. 3. What are some key stats from the NanoPlot HTML output report?.
2A. How many reads were sequenced? 2B. What is the mean read length? 2C. Why is the mean read length longer than the median read length? - Hint: think skewness https://wikipedia.org/wiki/Skewness What is the accuracy of sequencing data based on the NanoPlot HTML output report?.
- The accuracy of sequencing is defined by the Phred quality score, which is a numerical representation of the accuracy of base calls, and ranges from 0 to 99. For example, a Phred score of 20 (Q20) corresponds to a predicted error rate of 1%, indicating 99% accuracy.
- In the NanoPlot output, the ‘mean_qual’ value represents an average Phred score
3A. What is the mean read quality (mean_gual)? 3B. Given that Q20 quality (Phred) score corresponds to a read accuracy of 99% (or 1 in 100 errors), do you think this dataset is of a good sequence quality? What is some information provided by the plots in the NanoPlot HTML output report?
4A. Scroll down to view the ‘Weighted histogram of read lengths’ histogram. From this plot estimate the range of read lengths obtained. 4B. Scroll down to view the ‘Yield by length’ cumulative plot which shows sequencing yield based on read length. From this plot do shorter (10kb or less) or longer sequences produce more data?
4.3.5 Activity 2 – Taxonomy Profiling
Estimated time: 35 min
4.3.5.2 Instructions
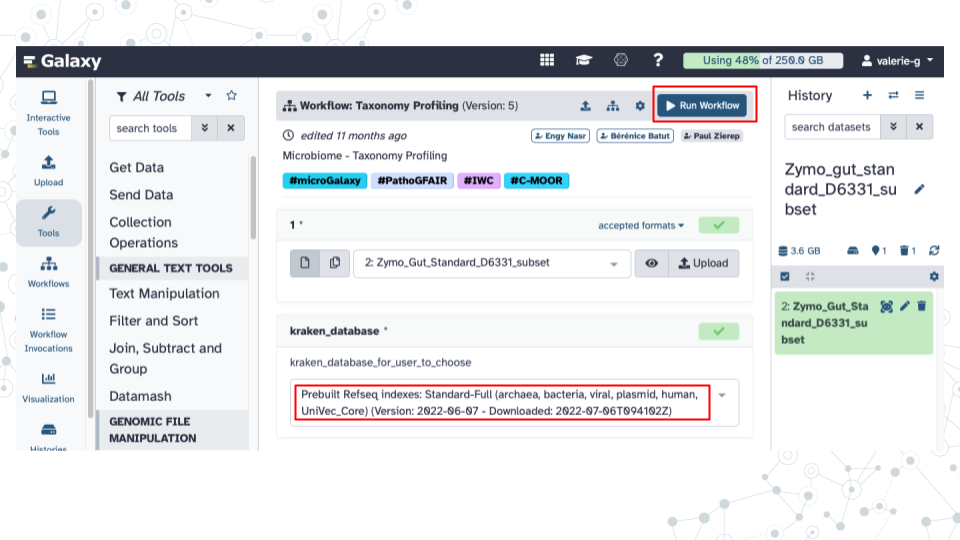
- Run ‘Taxonomy Profiling’ public workflow.
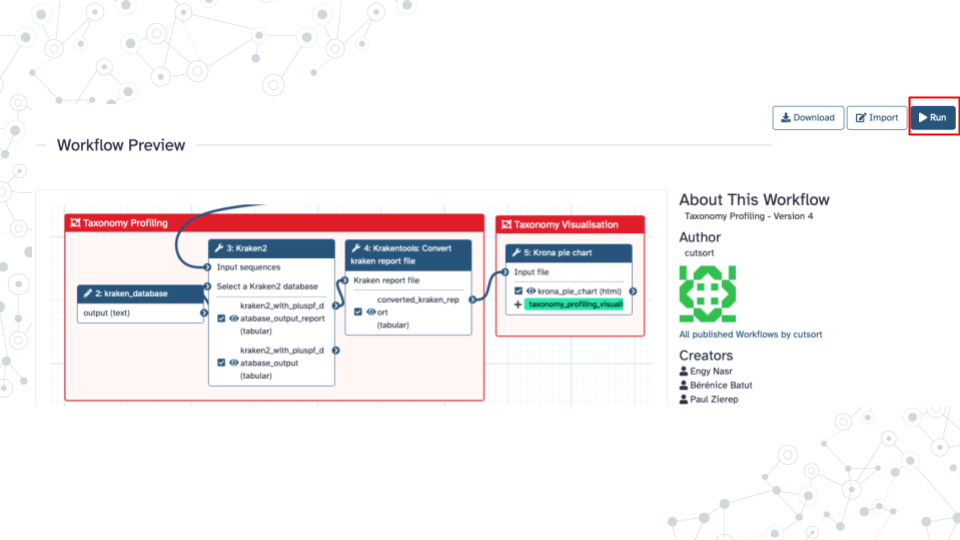
- Open the taxonomy-profiling public workflow https://usegalaxy.org/u/cutsort/w/taxonomy-profiling and click on Run.
- Browse to select your fastq dataset by clicking on the ‘…’ tab.
- Under kraken_database select Prebuilt Refseq indexes: PlusPF(Standard plus protozoa and fungi)(Version:2022-06-07 - Downloaded: 2022-09-04T165121Z).
- Click Run Workflow.
- Wait ~30 minutes as the Kraken 2, KrakenTools, and Krona jobs are scheduled, run, and complete. While you are waiting, continue with the next section of this prelab.
- Note, that it can take longer than 30 minutes to run the scheduled jobs in part, because Galaxy servers are public shared resources used concurrently by numerous users, so that when many users demand resources like CPU, memory, or disk space, it can create bottlenecks and delays, affecting the speed of your particular job.
- Examine select aspects of Kraken 2 tool.
- While the Taxonomy Workflow is running, click on the Tools icon on the left of the page.
- Then, in the search bar enter ‘Kraken 2’’ and select the Kraken2 tool.
4.3.5.3 Questions
| 1. How does Galaxy describe the Kraken 2 tool in its descriptor on top of the page? |
|---|
| 2. Scroll down to the Help/What it does section, and in your own words paraphrase the paragraph describing how Kraken 2 works. |
|---|
| 3. Record how many output files you obtained from the Taxonomy Workflow and list their names. |
|---|
4.3.5.5 Instructions
- Open and examine converted_kraken_report.
- Click on the Display icon (eyeball) next to the output file with converted_kraken_report. This report should look familiar from the week 1 taxonomy-profiling-spreadsheet activity.
- Scroll through to explore.
- Open and examine the kraken2_with_pluspf_database_output_report.
- Click on the Display icon (eyeball) next to the output file with kraken2_with_pluspf_database_output_report.
- This output report is an extended version of the converted_kraken_report.
- The output contains 6 columns. See info for select column headers below:
- Column 1: Percentage (%) of reads that map to a given taxon and its descendants
- Column 2: # of reads assigned to a given taxon and its descendants
- Column 3: # of reads assigned directly to a given taxon (not its descendants)
- Column 4: A rank code (see explanation below)
- Column 6: Identified taxa/scientific name
Note, some rank codes will have numbers associated with them; Ignore them for the moment.
Rank code:
    - (U)nclassified,
    - (R)oot,
    - (D)omain,
    - (K)ingdom,
    - (P)hylum,
    - (C)lass,
    - (O)rder,
    - (F)amily,
    - (G)enus,
    - (S)pecies.
4.3.5.6 Questions
Answer the following questions about the converted_kraken_report.
1A. How many Unclassified reads are there? 1B. How many Kingdoms are there and what are they? 1C. How many Phyla are there and what are they? 1D. Using the total number_of_reads you obtained from the NanoStats (NanoPlot) metrics, and the value of Unclassified reads from the converted_kraken_report, calculate the % unclassified and % classified taxa. 1E. Click on the converted_kraken_report entry and look just below the ‘Add Tags’ to see the number of lines and columns in the file. The number of lines corresponds to the number of taxa detected. Excluding the Unclassified taxa, how many taxa were identified? Answer the following questions about the kraken2_with_pluspf_database_output_report.
2A. What is the percentage of Unclassified taxa listed? - Note, percent will be found in column 1 of the report 2B. What is the percentage of Classified taxa? - Note, the document lists (U)nclassified taxa only, so you’ll need to calculate the percentage of Classified taxa. 2C. Find and record the 3 most abundant bacterial Phyla (p_) by percentages. As rows are not sorted by abundance, you may find it helpful to search using for “P” using <CTRL>-F to highlight rows corresponding to phyla.
4.3.5.8 Instructions
- View Krona pie chart output
- Krona pie chart is one of the outputs of the Taxonomy workflow, and it is an interactive visualization tool for exploring the composition of metagenomes.
- Click on the Display icon (eyeball) next to the Krona_pie_chart dataset to explore the results as a Krona pie chart.
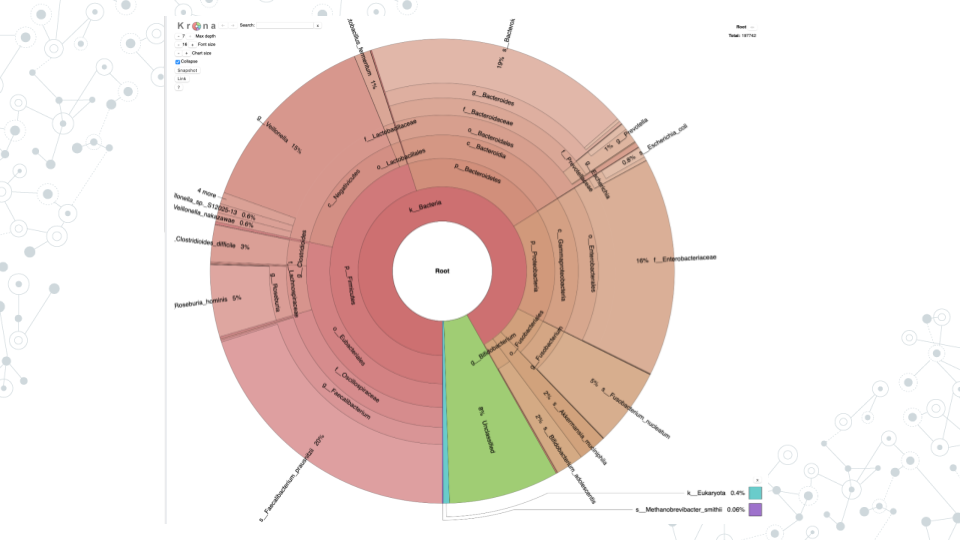
- For example, in Krona pie chart you can visualize:
- Percent Unclassified
- Different taxa such as phyla, where prefix “p_” corresponds to Phyla, or order, where prefix “o_” corresponds to Order, etc..
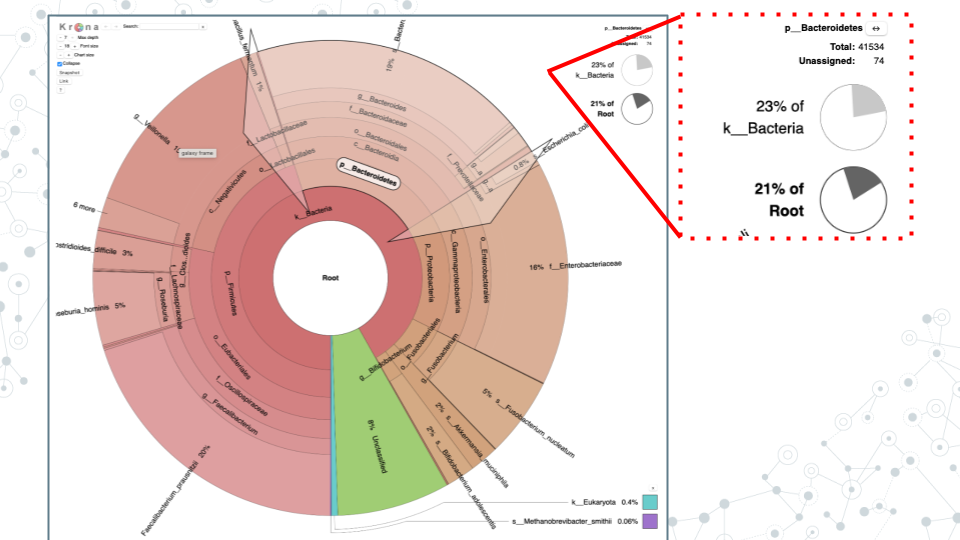
- Proportions of different taxa (number of reads and percentages). If you click on different phyla, which phylum chunk appears largest? For example, if you click on ”p_Bacteroidetes” you will see, at the top right corner, that it’s 41534 reads, make up 23% of kingdom Bacteria (or 21% of all reads (Root)).
- Answer the following questions based on Krona pie chart results
4.3.5.9 Questions
| 1. What are the 2 main phyla you observe? |
|---|
| 2. What appears to be the more diverse phyla of the two and why? |
|---|
| 3. How many reads and what percent of bacterial reads were classified as phylum Firmicutes. |
|---|
| 4. What is one of the most abundant Orders in the phylum Firmicutes based on number and % of reads? |
|---|
| 5. Within the most abundant Order from your answer above, record one Family member, one genus member and one species member; also include their percent abundances. |
|---|
| 6. Some potentially pathogenic bacterial species are often present in a healthy gut, but in relatively low amounts. What % of bacteria is represented by C. difficile (Clostridiodes difficile) in this gut standard sample? How does it compare to the expected proportion in the ZymoBIOMICS® Gut Microbiome Standard? |
|---|
4.3.7 Footnotes
Resources
- Google Doc
- Species composition in the Gut Microbiome Standard dataset: ZymoBIOMICS® Gut Microbiome Standard
- If interested reading more about Kraken 2, see Kraken 2 publication
Contributions and Affiliations
- Valeriya Gaysinskaya, Johns Hopkins University
- Frederick Tan, Johns Hopkins University
Last Revised: January 2026