
8.2 Activity: geNomad
8.2.1 Purpose
The goal of this activity is to identify plasmid and virus sequences with geNomad. geNomad is a modern classification tool that uses a dataset of over 200,000 gene markers specific to chromosomes, plasmids, or viruses to quickly find plasmids and viruses in metagenomic sequences. Additionally, geNomad uses a deep neural network approach that is gene-independent and reference alignment-independent to classify sequences as plasmids of viruses. Starting with contigs as your input, geNomad can:
- Identify sequences of plasmids and viruses
- Functionally annotate plasmid and viral genes
- Taxonomically classify viral sequences
8.2.2 Learning Objectives
- Run the geNomad tool in Galaxy
- Examine geNomad output (plasmids and virus)
- Plot geNomad output (plasmid length and number of genes) in RStudio on Galaxy
8.2.3 Activity 1 – Run geNomad
Estimated time: 10 min
8.2.3.1 Instructions
- Import the dataset corresponding to assembled contigs from PacBio-sequenced Zymo gut standard D6331 - a 3.4 Gb data subset assembled with Flye tool.
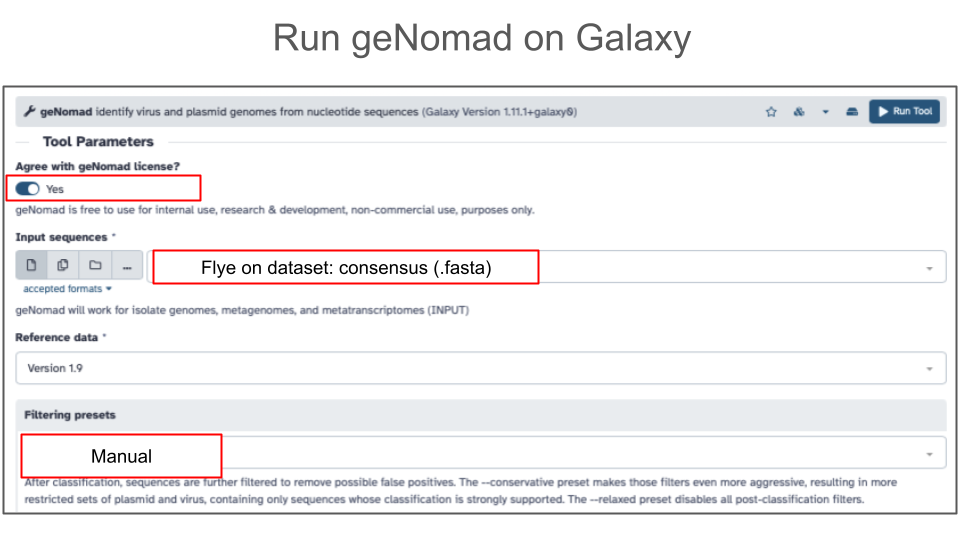
- Go to Tools and find geNomad
- Agree with geNomad license
- Use assembled contigs (from Flye assembly) as input
- Under filtering presets, select Manual settings which correspond to the default geNomad settings
- Click Run Tool
8.2.4 Activity 2 – Explore geNomad output in Galaxy
Estimated time: 10 min
8.2.4.1 Instructions
- Import two of eight geNomad output files for Zymo gut standard D6331 (Activity 1 output):
- View geNomad output files to explore.
8.2.4.2 Questions
- Click on geNomad-plasmid-summary file and answer the questions below:
| A. How many contigs were classified as plasmid-derived contigs? |
|---|
| B. Does every plasmid contig have a conjugation gene? |
|---|
| C. Does every plasmid contig have an amr_gene (anti-microbial resistance gene)? |
|---|
- Click on geNomad-virus-summary file and answer the questions below:
| A. How many contigs were classified as virus-derived contigs? |
|---|
| B. Google search full taxonomy of the first viral contig in the file and record below 1 thing you learned about this virus. |
|---|
| C. What is the most common genomic context (topology) in which virus was identified in this data subset? |
|---|
8.2.5 Activity 3 – Examine geNomad plasmids in RStudio
Estimated time: 15 min
8.2.5.1 Instructions
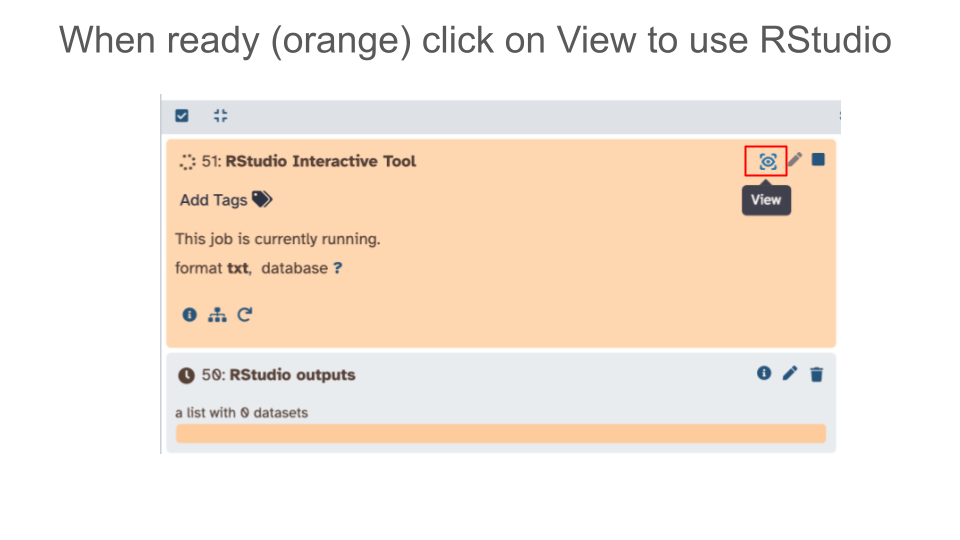
- Launch RStudio tool in Galaxy
- Click on “Interactive Tools” in the left hand Activity Bar and launch RStudio
- You don’t need to include input datasets with your RStudio launch - we will import data once RStudio is launched.
- Import data into RStudio
In your Galaxy history, identify which Galaxy history number (dataset) corresponds to the plasmid summary output file.
- Let’s assume dataset 41 in your Galaxy history is a plasmid summary file from geNomad and you want to read it into your RStudio.
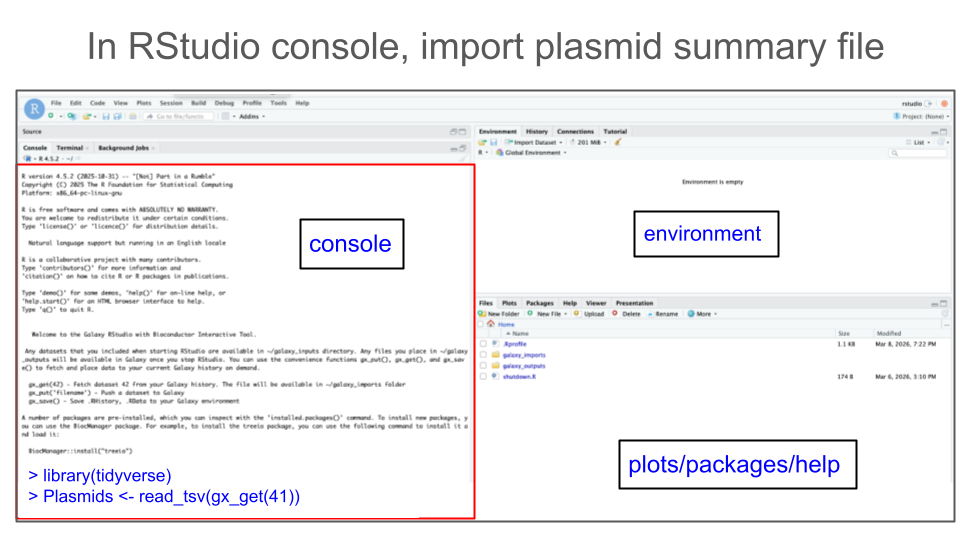
In your RStudio Console, use the function
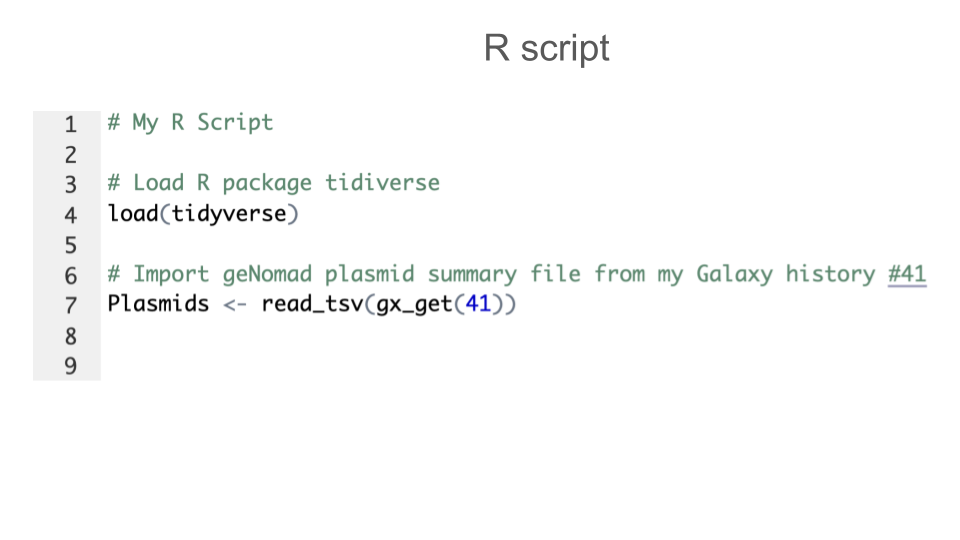
gx_get()to import (copy) a dataset of interest from Galaxy history to your RStudio session.# Get Galaxy history dataset #41 gx_get(41)In addition, you have to use a proper R function to read the file. To read tabular files formatted as tab-separated values (tsv), use function
read_tsv(). To do so, you will first need to load an R package calledtidyverse. Use the following pieces of code:# Load tidyverse library(tidyverse) # Read a .tsv file read_tsv(gx_get(41))Now that you have all pieces of code, save your tsv file as an object called, e.g.
plasmids(or give it another convenient name of your choice).# Final import command plasmids <- read_tsv(gx_get(41))Once code is ready, type the 2 commands (to load tidyverse, and to import plasmid_summary tabular file) into your RStudio console
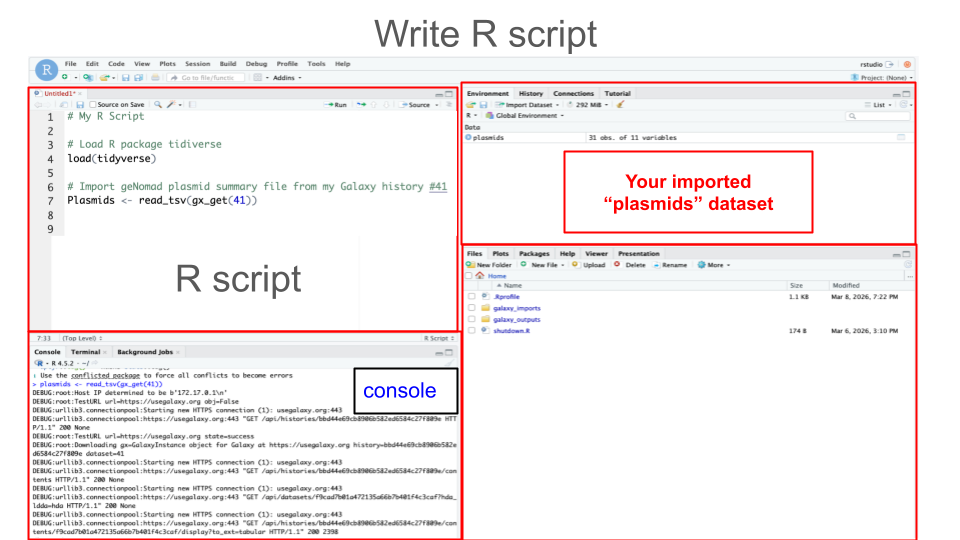
- Create an R script of the commands from Step 2:
- Just like the best practice for wet-lab experiments is keeping a lab notebook, the best practice for computational experiments is keeping a notebook with all your code (commands) - e.g. having a record of your R script.
- For best practice, you should annotate each block of code
8.2.5.3 Part 1 - Explore data in RStudio
- Preview first rows of a file using function
head().
| Command: head(plasmids) |
|---|
| Question: Copy and paste output of command below: |
| Answer: |
- View column names using function
colnames().
| Command: colnames(plasmids) |
|---|
| Question: Copy and paste output of command below: |
| Answer: |
- Summarize each variable using funciton
summary().
| Command: summary(plasmids) |
|---|
| Question: Copy and paste output of command below: |
| Answer: |
- Check the number of rows and columns - dimensions - of the file using function
dim().
| Command: dim(plasmids) |
|---|
| Question: Copy and paste output of command below: |
| Answer: |