
5.2 Lab Activity: Differential Gene Expression
5.2.1 Purpose
The purpose of this tutorial is to start asking questions about differential gene expression that you can turn into your project.
5.2.2 Learning Objectives
- Use R to analyze Gene Sets
- Describe Differential Expression Analysis
- Create and analyze histograms from HTSeq files
- Calculate Differential Gene Expression in real scientific data
5.2.3 Introduction
In today’s lab we will learn a hand-full of methods for looking at gene expression across the Drosophila midgut. As you work through the lab, think about scientific questions you could ask with the data, and what methods and samples would be useful for answering those questions.
5.2.4 Activity 1 - Differential Expression Tutorial
Estimated time: 45 min
5.2.4.1 Instructions
Access the C-MOOR Tutorials
- If you are using SciServer, log into SciServer, click on compute and open your “C-MOOR LearnR” container. Visit SciServer Guides and FAQs if you need to jog your memory on how to do this.
- If you are using AnVIL, log into AnVIL, navigate to your class Workspace, start up an RStudio Cloud Environment, and open RStudio. Visit the AnVIL Guides and FAQs if you need to jog your memory on how to do this. This module can be found in the “9-diff-exp” folder of the “rnaseq” curriculum folder.
- If you are using an alternative setup, follow the instructions provided by your instructor.
Start the “Differential Expression in DESeq2” tutorial
To move through the activities click “Continue” at the bottom of the screen. When you are done with a topic, click “Next Topic” to move on.
This tutorial has small boxes in which you can enter and run short lines of code to analyze the data.
Use the Notes section below to copy and paste important blocks of code that you can refer back to later.
As you work through the tutorial, answer the questions below.
5.2.5 Activity 2 - Try it Out!
Estimated time: 45 min
5.2.5.1 Instructions
Work with a partner to complete the following analysis using the Try it Out section of the tutorial.
5.2.5.2 Questions
| Create a clusterProfiler graph comparing “p1” and “p2_4”. |
|---|
| INSERT YOUR GRAPH |
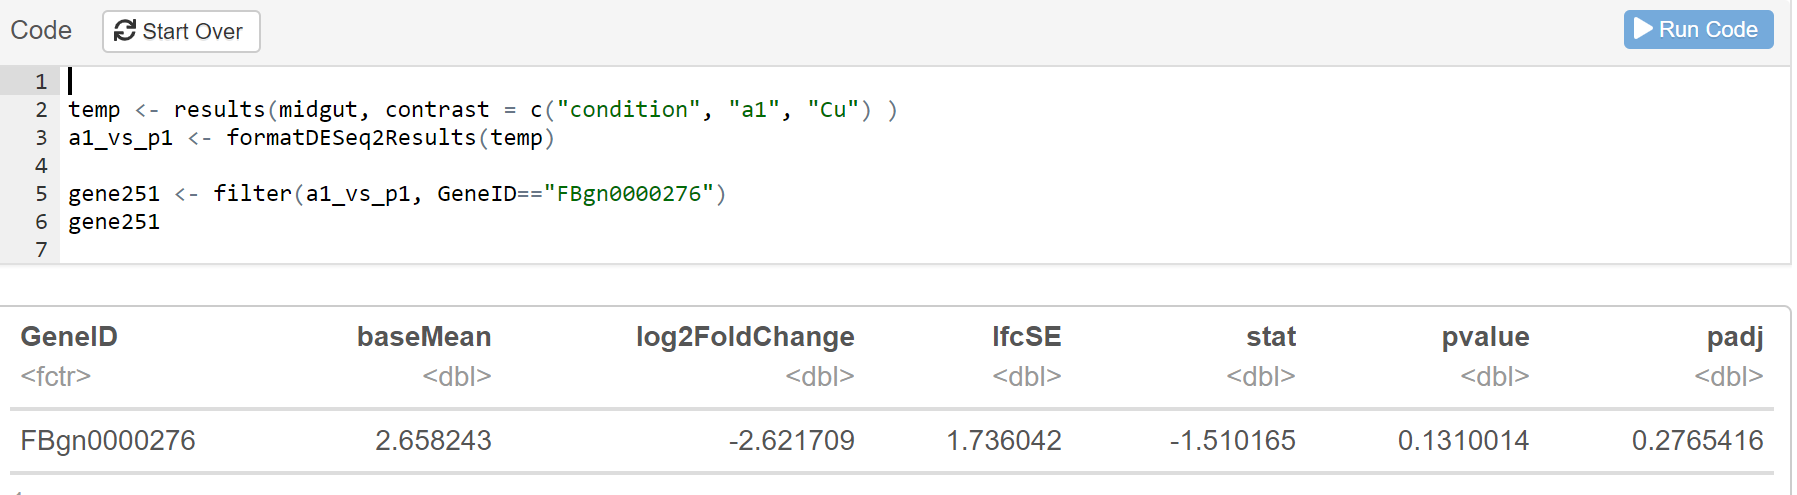
| Practice looking up a gene. Compare “p1” and “p2_4” and look up the gene FBgn0033873. What is the log2FoldChange for this gene? |
|---|
| Graph FBgn0033873 across all the regions of the gut |
|---|
| INSERT YOUR GRAPH |
| Graph the gene your group worked on in the Biological Databases Lab across all the regions of the gut. |
|---|
| INSERT YOUR GRAPH |
5.2.6 Activity 3 - Brainstorm with Your Group
Estimated time: 30 min
5.2.6.1 Instructions
- Use this time to discuss possible research questions for your group project. Some idea might include:
- An analysis of a pathway or set of genes across the gut.
- A detailed look at one of the three larger regions and the differences between the small segments within it.
- How would you get started? Run some preliminary analysis and use the space below to take notes or save code that might be useful for you as you continue with your project.
- Post your initial idea for a project on the class padlet, along with the names of everyone in your group.