Chapter 6 Reference - Meet the MISO study
Let’s get prepared to do some research using 16S rRNA data! In this section, we’ll be exploring data from Impact of a 7-day homogeneous diet on interpersonal variation in human gut microbiomes and metabolomes by Guthrie et al. (2022). This study is one of many that explores the relationship between diet and the human gut microbiome and will help familiarize us with the format that 16S rRNA data takes. We’ll start slow and look at just a few lines of data in Google Sheets and then use phyloseq and DESeq2 in R to take our analysis to the next level.
Human diet has been implicated heavily in the establishment and maintenance of the gut microbiome. For example, human babies undergo a drastic change in the gut microbiome following the transition to solid food.
It’s difficult to capture the mechanisms and effects of diet on the gut microbiome given the sheer number of variables involved. The microbiome individuality and stability over time (MISO) study aimed to explore the connection between diet, microbiome, and metabolites by looking at the effect of feeding a standardized diet to people over 7 days.
6.0.1 MISO study diet and sampling schedule
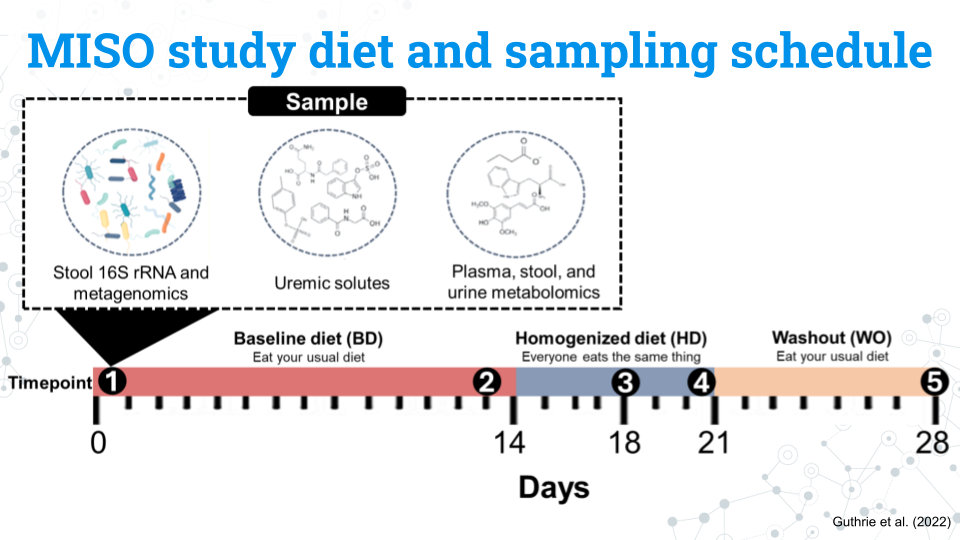
The figure above shows the study design for the MISO study. You do not need to memorize all these details; feel free to refer to this page throughout the project:
- Participants eat their usual, baseline diet (BD) for 14 days
- Participants all eat the same diet, the homogenized diet (HD), for 7 days
- Participants return to their usual diet during the washout (WO) period for 7 days
The study lasts a total of 28 days. Samples from the blood, stool, and urine, our metabolite and 16S rRNA data are taken at 5 different timepoints:
- Timepoint 1: Day 0 (the start of the study)
- Timepoint 2: Day 13
- Timepoint 3: Day 17
- Timepoint 4: Day 21
- Timepoint 5: Day 28
6.0.2 MISO study variables and factors
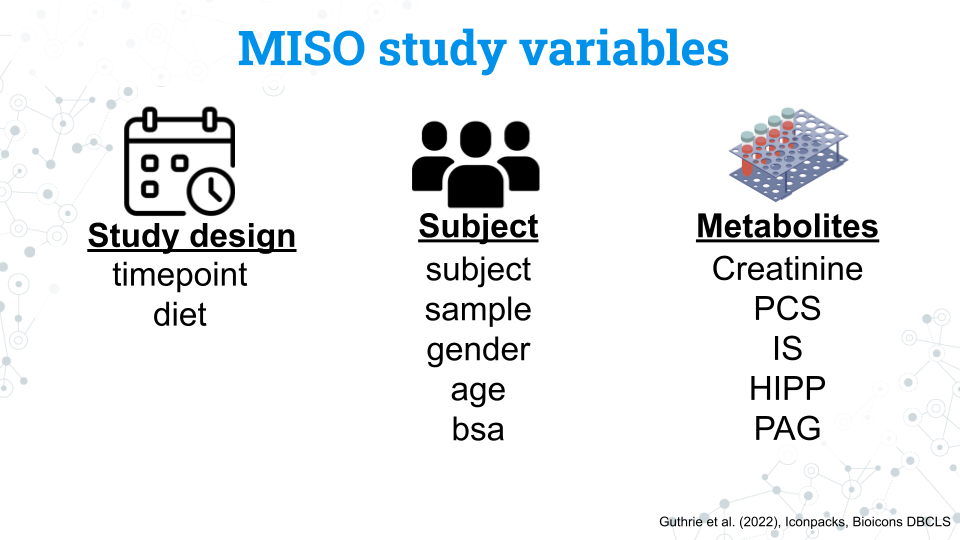
We have a number of variables we can use in our analysis. Notice that the variables for the study and subjects are in lowercase. This is also how you will access these variables in R.
6.0.2.1 Study design variables
| Variable | What is it? | Factors |
|---|---|---|
| timepoint | The 5 samplings that occur on days 0, 13, 17, 21, and 28 coded as timepoints 1 through 5 | 1, 2, 3, 4, 5 |
| diet | The diet the subject was on during the sampling | BD, HD, WO |
6.0.2.2 Subject variables
| Variable | What is it? | Factors |
|---|---|---|
| subject | A unique ID given to each subject (participant) | S## (ex. S02 is subject 2. Note that while there are a total of 21 subjects in the study, but their subject numbers are not 1 through 20 |
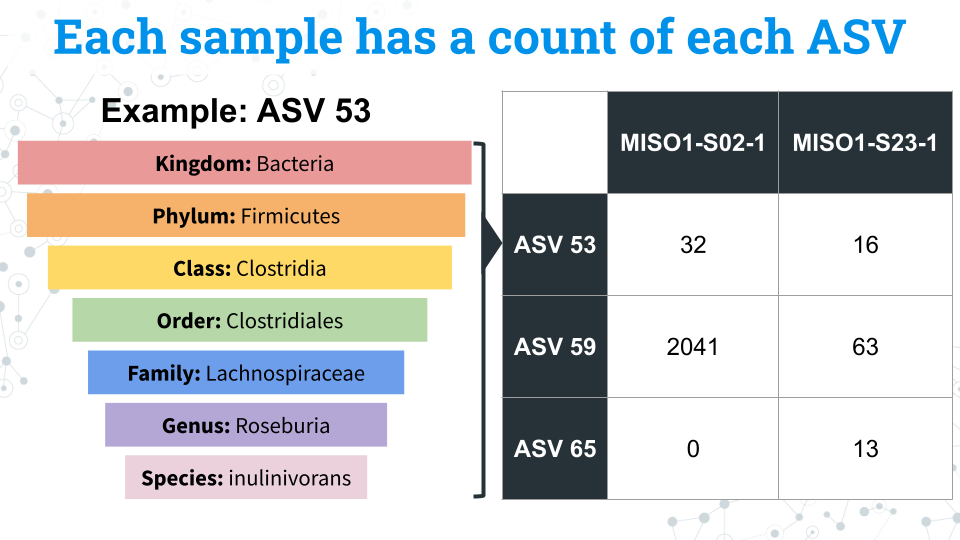
| sample | A unique ID given to every sample taken during the study that includes the subject and timepoint of the sample | MISO-Subject##-Sample# (ex. MISO1-S02-1 is the sample from subject 2 at timepoint 1) |
| gender | The gender of the subject | M, F. All subjects were cisgender |
| age | The age in years of the subject | A continuous variable from 23 to 75 years old |
| bsa | Body surface area; a measure of body size | A continuous variable from 1.6 to 2.8 |
6.0.2.3 Metabolite variables
| Variable | What is it? | Factors |
|---|---|---|
| Creatinine | Creatinine | A continuous variable from 1072 to 3971 |
| PCS | p-cresol sulfate | A continuous variable from 2 to 95 |
| IS | Indoxyl sulfate | A continuous variable from 3 to 58 |
| HIPP | Hippuric acid | A continuous variable from 16 to 1119 |
| PAG | Phenylacetylglutamine | A continuous variable from 16 to 318 |
6.0.3 Amplicon sequence variants (ASVs) data
Finally we have our microbe count data, or our Amplicon Sequence Variants (ASVs). Each ASV is a unique sequences that differs by as little as a single nucleotide from other ASVs and represents a specific microbe. We have assigned taxonomy to these microbes, but not all microbes have taxonomic data through the species level. These missing fields will appear as NA in the data.
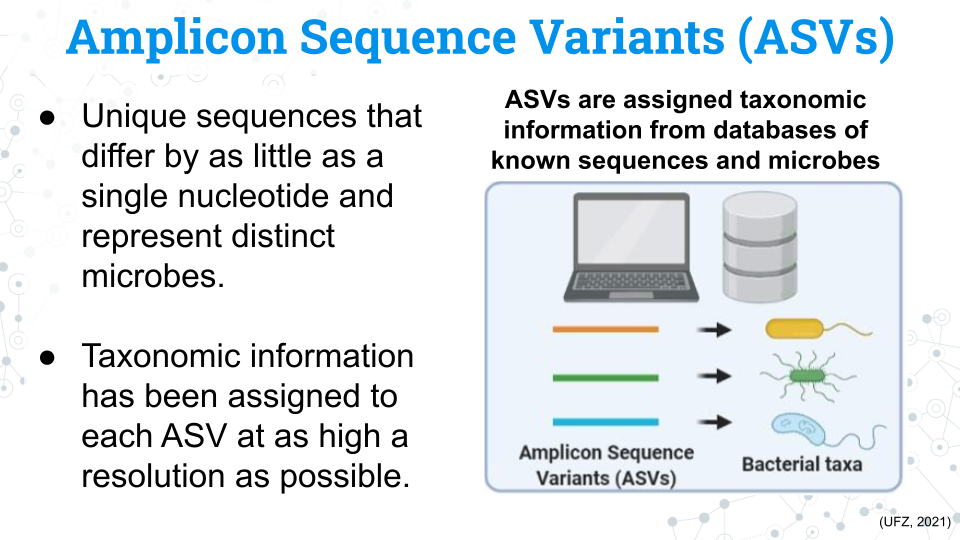
You may see the word Operational Taxonomic Unit (OTU) in phyloseq and in other published studies. ASVs and OTUs have some differences between them but they both represent distinct units of microbial taxa, although they have some key differences.
Each sample is associated with a count of each ASV. We can compare the counts of these ASVs between samples to determine differences in the composition of the microbiome between samples.