
2.4 Code examples
You can demonstrate code like this:
output_dir <- file.path("resources", "code_output")
if (!dir.exists(output_dir)) {
  dir.create(output_dir)
}
And make plots too:
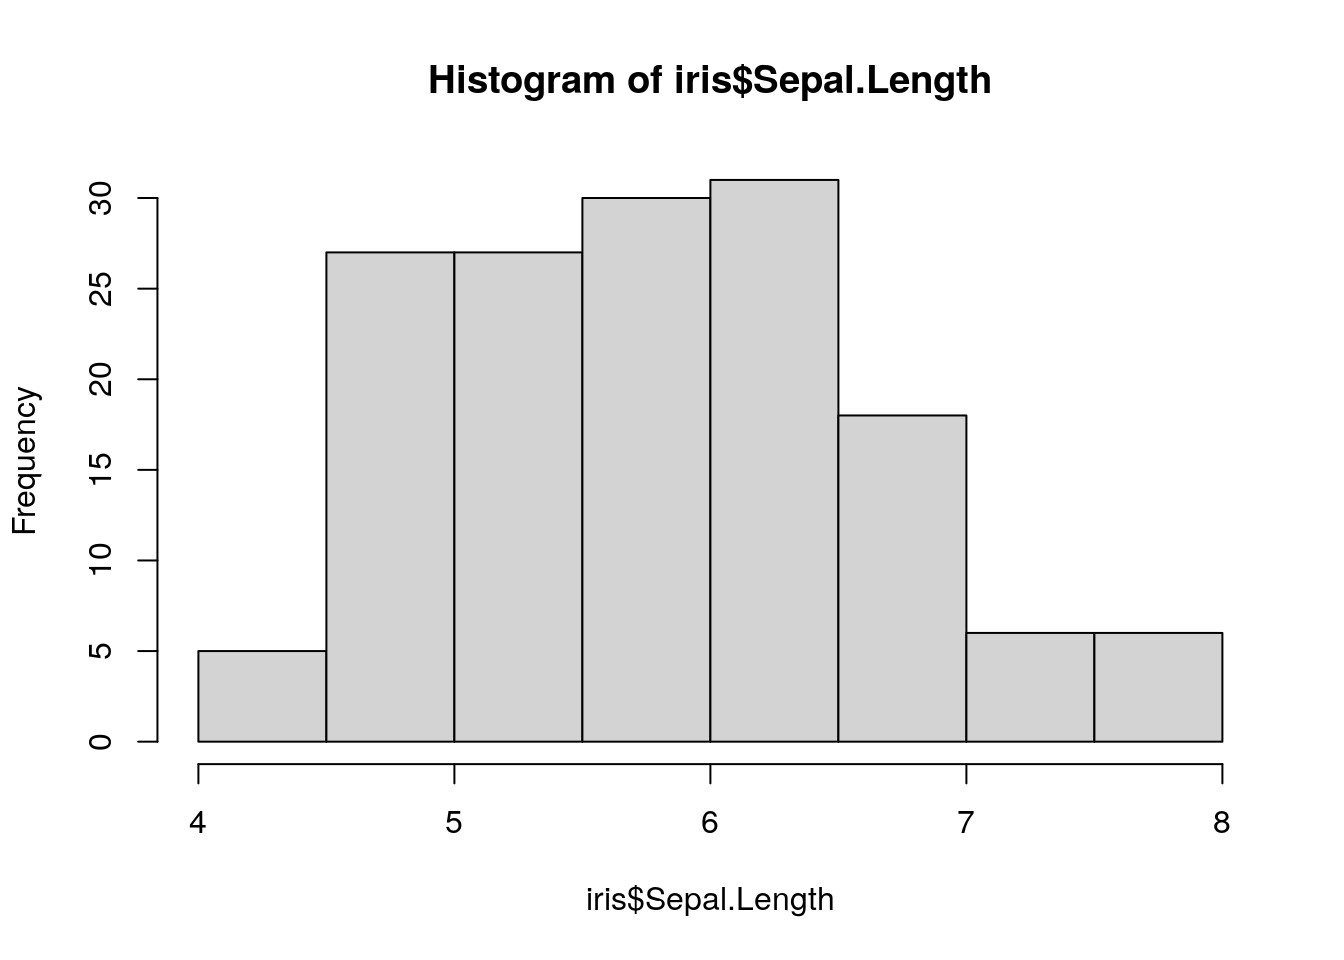
You can also save these plots to file:
## $breaks
## [1] 4.0 4.5 5.0 5.5 6.0 6.5 7.0 7.5 8.0
##
## $counts
## [1]  5 27 27 30 31 18  6  6
##
## $density
## [1] 0.06666667 0.36000000 0.36000000 0.40000000 0.41333333 0.24000000 0.08000000
## [8] 0.08000000
##
## $mids
## [1] 4.25 4.75 5.25 5.75 6.25 6.75 7.25 7.75
##
## $xname
## [1] "iris$Sepal.Length"
##
## $equidist
## [1] TRUE
##
## attr(,"class")
## [1] "histogram"## png
## 2